
A sales reporting dashboard you build around your own questions
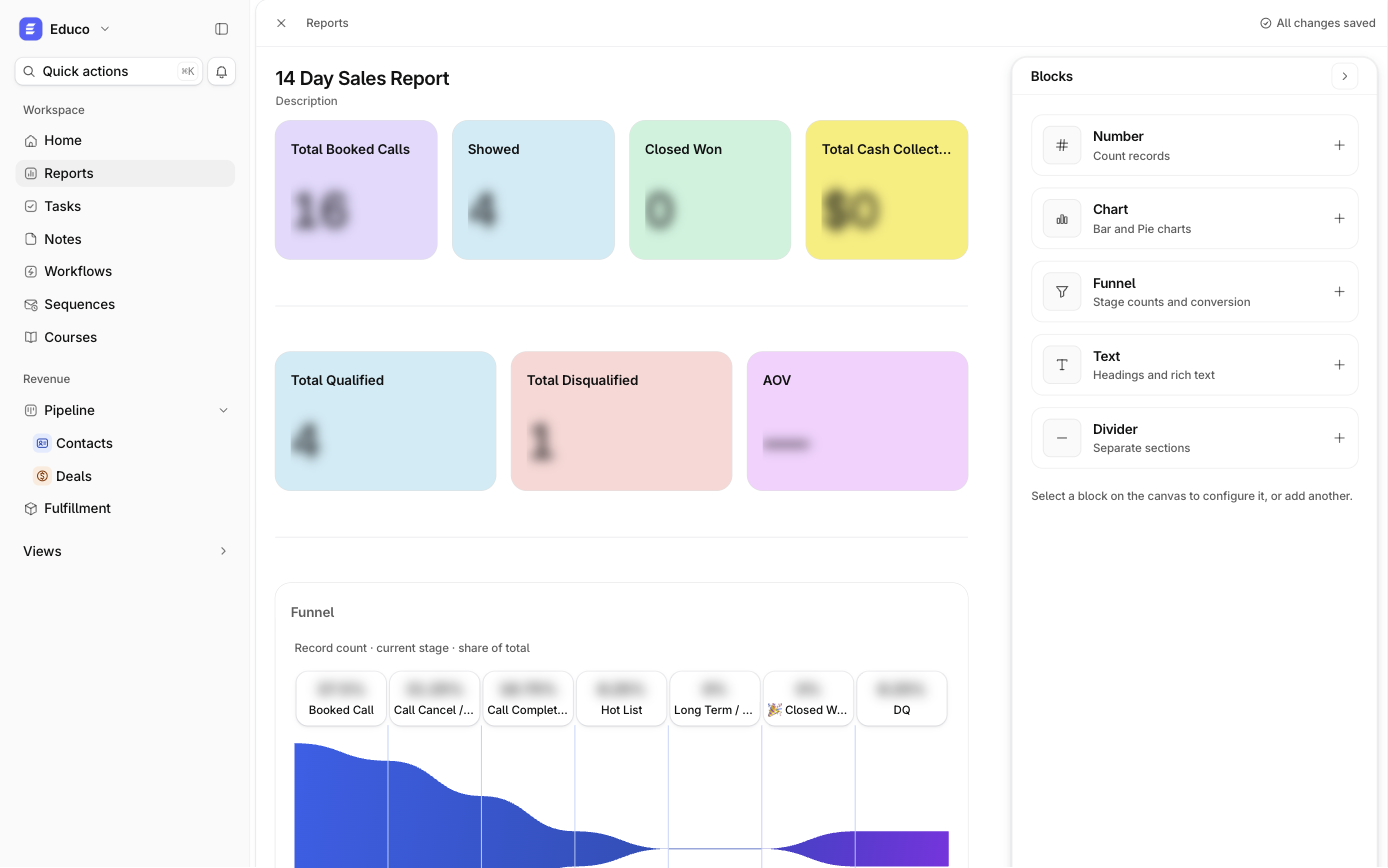
Ariyel Reports is a drag-and-drop canvas where you combine live Number, Chart (bar or pie) and Funnel blocks built on your contacts and deals, plus Text and Divider blocks that explain what each number means. Funnels can show either where deals sit today or how they've converted from stage to stage over time.
A dashboard is only useful if it changes what you do on Monday. Ariyel doesn't ship a wall of preset charts. Each block starts with a question, a set of records and the right visualization, and Text blocks say in plain language what the reader is looking at.
Five block types
| Block | What it shows | Good for |
|---|---|---|
| Number | Record count, or Sum / Average / Median / Min / Max of a number or currency field | "Open deals," "Pipeline value," "Average deal size" |
| Chart | Bar or Pie by a category field; counts, numeric summaries, or Distinct count | "Pipeline value by stage," "Leads by source," "Deals by owner" |
| Funnel | Stage, Status or any custom single-select, as counts or a numeric sum; shown as Funnel, Funnel Metric or Funnel Steps | Conversion and drop-off |
| Text | Headings, lists, links, @mentions of members, contacts or deals | Explaining the question; owners of each number |
| Divider | A visual break | Separating "Sales" from "Clients" |
Every data block has its own scope: All Records, or Specific Records using the same filter builder as the rest of Ariyel. One canvas can put "open deals this quarter" beside "all clients by service line."
Two funnels, two different questions
Most CRM funnel reports blur these together. Ariyel makes you choose:
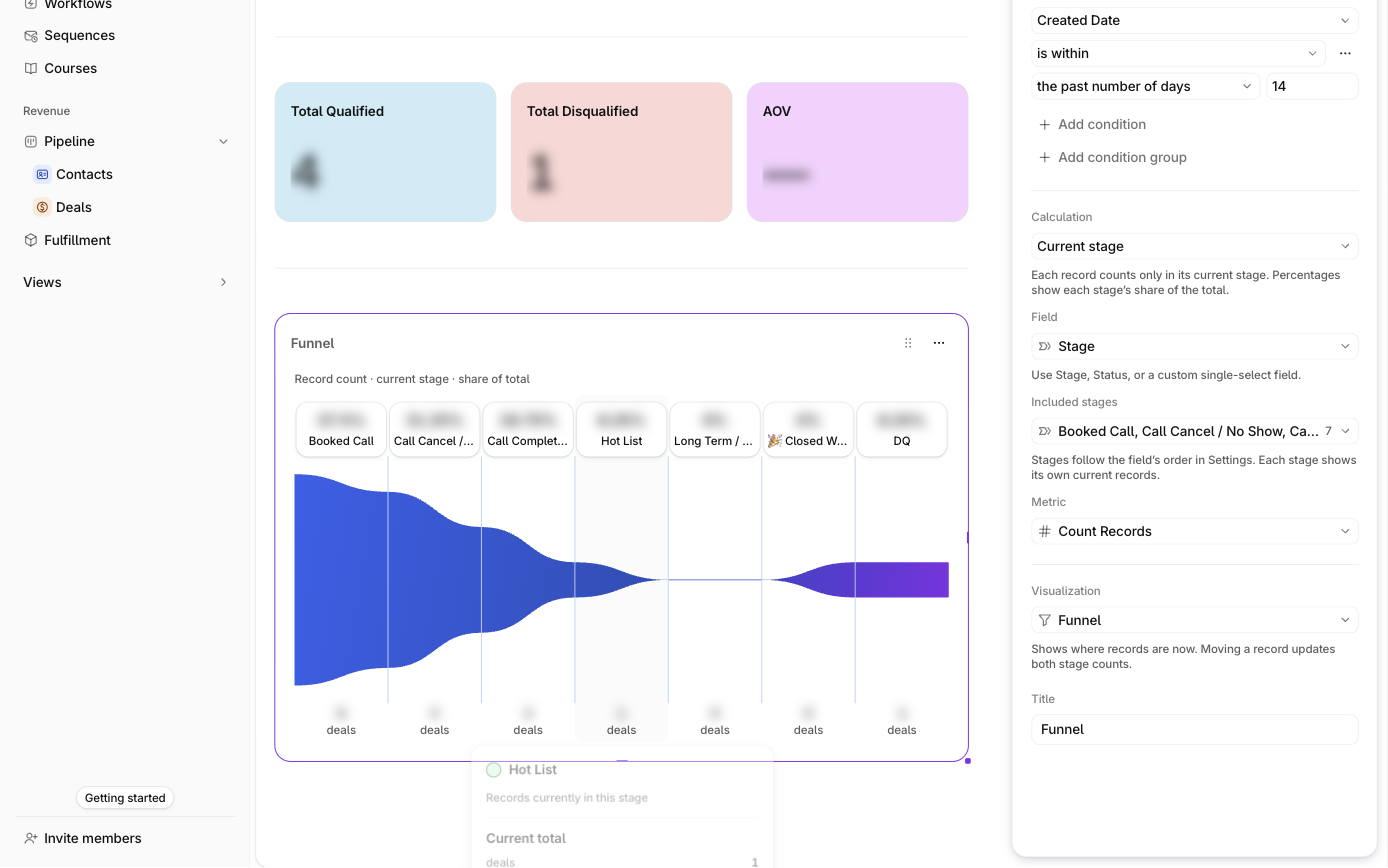
- Current stage counts each deal only where it is now. Percentages are shares of the whole filtered group. Question it answers: "Where is our pipeline sitting right now?"
- Historical progression counts deals that reached or passed each selected stage. Skipped stages count, moving backward doesn't erase progress, and each stage shows conversion from the previous stage and the drop-off. Question it answers: "Of the deals that got a proposal, how many closed?"
End a progression funnel at one outcome (Closed won), not Won and Lost as consecutive steps. Hover or click a stage to see its numbers.
Example: a weekly sales review for a consulting firm
- Text: "Weekly sales review. Owner: [@ Sales lead]. Open deals only unless stated."
- Number: Open deals (Specific Records: Stage is none of Closed won, Closed lost).
- Number: Pipeline value: Sum of Deal value, same scope, with a background color.
- Chart (bar): Deal value by Stage, Sum, sorted by X-axis.
- Funnel (historical progression): Qualified → Proposal sent → Negotiation → Closed won.
- Divider
- Chart (pie): Contacts by Lead strength. How warm is the list? See Ari.
Built for a team, readable on a phone
- Everyone in the workspace can open, edit, duplicate and delete any report, so the sales lead and the founder can work on the same canvas.
- Changes save automatically (Saving… → All changes saved).
- On a phone the canvas stacks in reading order, with Numbers side by side in pairs.
- Charts page through up to 25 categories at a time, and Include empty records lets you check exactly what a total covers.
How it works in Ariyel
- Write the question first: "How much open pipeline do we have, and where does it leak?"
- Reports → New report, then name it and add a description.
- Add a block, choose Contacts or Deals, then All Records or Specific Records.
- Pick the calculation: count vs sum, current stage vs historical progression.
- Add a Text block above each section saying what's included.
- Open the underlying records for anything surprising before acting on it.
Implemented for you
Ariyel's team builds your first report with you during implementation, usually the weekly pipeline review, and makes sure the stages and fields it depends on are filled in consistently. A report is only as honest as the data under it. See how implementation works.
FAQ
Can I see conversion rate between pipeline stages? Yes. Use a Funnel with Historical progression. Each stage shows conversion from the previous stage and the drop-off.
Can I report on a custom field like lead source? Yes. Any single-select can be a chart category or a funnel field, and number or currency fields can be summed or averaged.
Is the data live? Yes. Blocks summarize current records each time the report is opened. A report doesn't create or store records of its own.